Class 7: Biases in ML, Discriminatory Advertising
Motivation
Machine learning algorithms are playing increasingly important roles in many critical decision making tasks. However, studies reveal that machine learning models are subject to biases, some of which stem from historical biases in human world that are captured in training data. Understanding potential bias, identifying and fixing existing bias can help people design more objective and reliable decision making systems based on machine learning models.
Ad Transparency
Athanasios Andreou, Giridhari Venkatadri, Oana Goga, Krishna P. Gummadi, Patrick Loiseau, Alan Mislove. Investigating Ad Transparency Mechanisms in Social Media: A Case Study of Facebook’s Explanations. NDSS, 2018. [PDF] (All images below are taken from this paper.)
What are ad transparency mechanisms in social media?
Transparency mechanisms are solutions for many privacy complaints from users and regulators. Users have little understanding of what data the advertising platforms have about them and why they are shown particular ads. The transparency mechanisms provided by Facebook are (1) the “Why am I seeing this?” button that provides users with an explanation of why they were shown a particular ad (ad explanations), and (2) an Ad Preferences Page that provides users with a list of attributes Facebook has inferred about them and how (data explanations). Twitter offers similar transparency mechanisms, including a “Why am I seeing this?” botton that provides users with an explanation of why they were shown a particular ad (ad explanations) in Twitter.
What did this paper do?
This paper reports on an investigation and analysis of ad explanations (why users see a certain ad), and an investigation of data explanations (how data is inferred about a user), which is strongly related to the ad transparency mechanisms in Facebook. This paper first introduced how ad platform in Facebook works and then evaluate the two transparency mechanisms we introduced before with some properties.
The Ad platform in Facebook
There are three main processes in the Facebook ad platform: a) the data inference process; b) the audience selection process; c) the user-ad matching process.
(a) The data inference process is the process that allows the advertising platform to learn the users’ attributes. It has three parts: (1) the raw user data (the inputs), containing the information the advertising platform collects about a user either online or offline; (2) the data inference algorithm (the mapping function between inputs and outputs), covering the algorithm the advertising platform uses to translate input user data to targeting attributes; (3) the resulting targeting attributes (the outputs) of each user that advertisers can specify to select different groups of users.
(b) The audience selection process is the interface that allows advertisers to express who should receive their ads. Advertisers create audiences by specifying the set of targeting attributes the audience needs to satisfy. Later, to launch an ad campaign, advertisers also need to specify a bid price and an optimization criterion.
(c) The user-ad matching process takes place whenever someone is eligible to see an ad. It examines all the ad campaigns placed by different advertisers in a particular time interval, their bids, and runs an auction to determine which ads are selected.
Ad Explanations and the experiments on this transparency mechanism
As you can see in the picture, there are both attritubutes and potentional attritubutes here.
This paper used 5 different properties to evaluate the performance of Ad explanations:
- Correctness: Every attribute listed was used by the advertiser
- Personalization: The attributes listed are unique to the individual
- Completeness: If all relevant attributes are included in the explanation
- Consistency: Users with the same attributes see the same explanations
- Determinism: A user would see the same explanation for ads based on the same target attributes
The paper evaluated the ad explanations by using Chrome browser extension to record ads and explanations. The experiment had 35 users’ data across 5 months. This experiment also evaluated the data explanation. This paper made simple statistics for the explanation (see the following figure). And then, it shows the results of different properties on this experiment.
Data Explanations Experiments
The data explanations is applied in “Your interests” part as shown in the following picture.
The properties here are not the same as those used in the Ad explanation part. There are 3 new properties.
- Specificity: A data explanation is precise if it shows the precise activities that were used to infer an attribute about a user.
- Snapshot completeness: A data explanation is snapshot complete if the explanation shows all the inferred attributes about the user that Facebook makes available.
- Temporal completeness: a temporally complete explanation is one where the platform shows all inferred attributes over a specified period of time.
The results of different properties on this experiment are showed below:
Conclusion
While the Ad Preferences Page does bring some transparency to the different attributes users can be targeted with, the provided explanations are incomplete and often vague. Facebook does not provide information about data broker-provided attributes in its data explanations or in its ad explanations.
Discrimination in Online Targeted Advertising
Till Speicher, Muhammad Ali, Giridhari Venkatadri, Filipe Nunes Ribeiro, George Arvanitakis, Fabrício Benevenuto, Krishna P. Gummadi, Patrick Loiseau, Alan Mislove. Potential for Discrimination in Online Targeted Advertising. Proceedings of the 1st Conference on Fairness, Accountability and Transparency, PMLR 81:5-19, 2018. [PDF]
Recently, online targeted advertising platforms like Facebook have received intense criticism for allowing advertisers to discriminate against users belonging to protected groups.
Facebook, in particular, is facing a civil rights lawsuit for allowing advertisers to target ads using an attribute called “ethnic affinity.” Facebook has clarified that “ethnic affinity” does not represent ethnicity, but rather represents a user’s affinity for content related to different ethnic communities. Facebook has agreed to rename the attribute to “multicultural affinity” and to disallow using this attribute to target ads related to housing, employment, and financial services.
However, Facebook offers many different ways to describe a set of targeted users, so it’s not adequate to disallow targeting on certain attributes. In this paper, the authors develop a framework for quantifying ad discrimination and show the potential for discriminatory advertising using the three different targeting methods on Facebooks advertising platform: personally identifiable information (PII)-based targeting, attribute-based targeting, and look-alike audience targeting.
Quantifying Ad Discrimination
The authors identify three potential approaches to quantifying discrimination.
Based on advertiser’s intent: The authors reject this approach since it is hard to measure and it does not capture unintentionally discriminatory ads.
Based on ad targeting process: This category includes existing anti-discrimination measures, like disallowing use of sensitive attributes when defining a target population. The authors reject this approach since it breaks down when there exist several methods of targeting a population.
Based on targeted audience (outcomes): This approach takes into account only which users are targeted, not how they are targeted. The authors use this approach to quantify ad discrimination since outcome-based analyses generalize independent of targeting methods.
The authors formalize outcome-based discrimination as follows:
The authors define a metric for how discriminatory an advertiser’s targeting is, inspired by the disparate impact measure used for recruiting candidates from a pool.
Define the representation ratio measure to capture how much more likely a user is to be targeted when having the sensitive attribute than if the user did not have the attribute:
$$\text{rep_ratio}_s(\mathbf{TA}, \mathbf{RA}) = \dfrac{|\mathbf{TA} \cap \mathbf{RA}_s|/|\mathbf{RA}_s|}{|\mathbf{TA} \cap \mathbf{RA}_{\neg s}|/|\mathbf{RA}_{\neg s}|}$$
where \(\mathbf{RA}_s = {u \in \mathbf{RA} | u_s = 1 }\) is the subset of the relevant audience with the sensitive attribute and \(\mathbf{RA}_{\neg s} = {u \in \mathbf{RA} | u_s = 0}\) is the complementary subset of the relevant audience without the sensitive attribute
Define the disparity in targeting measure to capture both over- and under-representation of a sensitive attribute in a target audience:
$$\text{disparity}_s(\mathbf{TA}, \mathbf{RA}) = \max\left(\text{rep_ratio}_s(\mathbf{TA}, \mathbf{RA}), \dfrac{1}{\text{rep_ratio}_s(\mathbf{TA}, \mathbf{RA})}\right)$$
Disparity must be computed based on the relevant audience \(\mathbf{RA}\) because \(\mathbf{RA}\) may have a different distribution of the sensitive attribute than the whole database \(\mathbf{D}\). The authors assume that sensitive attributes considered have the same distributions in the relevant audience as the global population, and therefore high disparity in targeting is evidence of discrimination. Following the “80%” disparate impact rule, a reasonable disparity threshold for a group to be over- or under-represented may be \(\max(0.8, 1/0.8) = 1.25\).
The recall of an ad quantifies how many of the relevant users with the sensitive attribute the ad targets or excludes:
$$\text{recall}(\mathbf{TA}, \mathbf{RA}') = \dfrac{|\mathbf{TA} \cap \mathbf{RA}‘|}{|\mathbf{RA}‘|}$$
where \(\mathbf{RA}'\) is one of \(\mathbf{RA}_s\) or \(\mathbf{RA}_{\neg s}\) depending on whether we’re considering the inclusion or exclusion of \(\mathbf{S}\).
PII-Based Targeting
PII-based targeting on the Facebook advertising platform allows advertisers to select a target audience using unique identifiers, like phone numbers, email addresses, and combinations of name with other attributes (e.g. birthday or zip code). The authors show that public data sources, such as voter records and criminal history records, contain sufficient PII to construct a discriminatory target audience for a sensitive attribute without explicitly targeting that attribute.
The authors constructed datasets to show that they could implicitly target gender, race, and age using North Carolina voter records. Each of these attributes is listed in voting records, and the remaining fields together uniquely identify the voter (i.e., last name, first name, city, state, zip code, phone number, and country). The authors uploaded datasets targeting values of each attribute and recorded Facebook’s estimated audience size.
The Voter Records column shows the distribution of attribute values in the voter records data set. For a given attribute, the Facebook Users column shows how many of the 10,000 people in the dataset constructed for that attribute are actually targetable on Facebook (as reported by the Facebook advertising platform). The final column shows the portion of the targetable users who actually match the targeted attribute, found by restricting the target audience using Facebook’s records of the sensitive attribute. High targetable percentages values show that the voter records overlap significantly with the voter records data set. High validation percentages show that the auxiliary PII was highly accurate at describing particular users with the targeted attribute. Note that there are some low validation percentages, which the authors attribute to Facebook’s inaccurate or incomplete records of some data (for example, they do not know race, only “multicultural affinity”).
Attribute-Based Targeting
Attribute-based targeting allows advertisers to select a target audience by specifying that targeted users should have some attribute or combination of attributes. The authors group these attributes into two categories: curated attributes and free-form attributes. Curated attributes are well-defined binary attributes spanning demographics, behaviors, and interests — Facebook tracks a list of over 1,100 of these. Free-form attributes describe users inferred interest in entities such as websites and apps as well as topics such as food preferences or niche interests. The authors estimate that there are at least hundreds of thousands of free-form attributes.
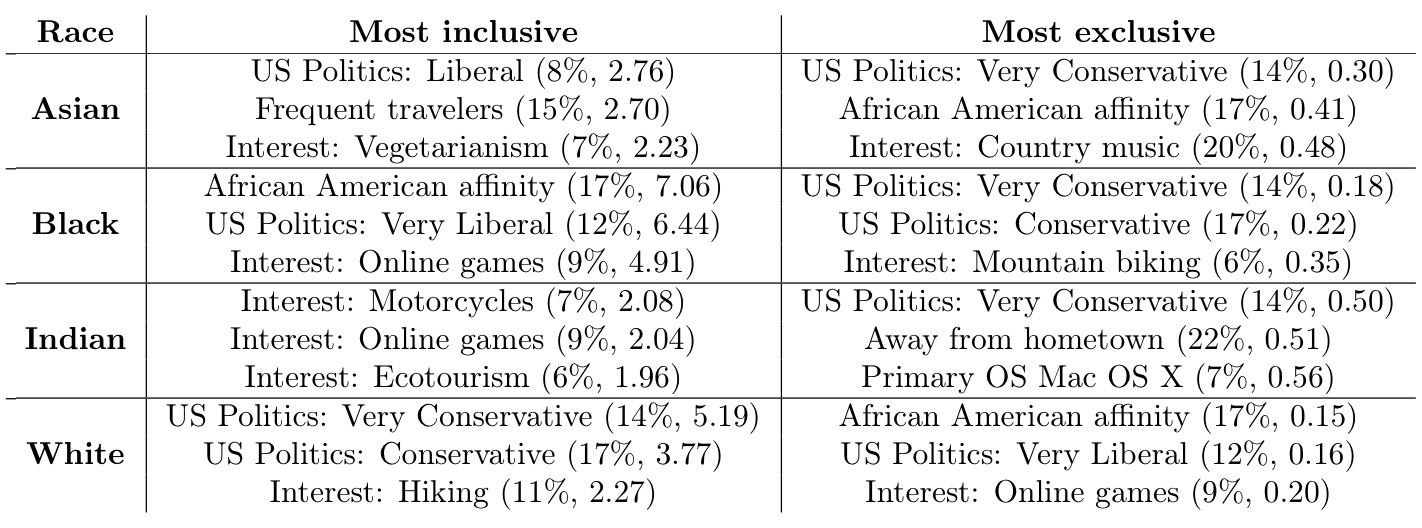
The authors demonstrate that many curated attributes are correlated with sensitive attributes like race, and can therefore be used for discriminatory audience creation. The following table shows experimental results obtained by uploading sets of voter records filtered to contain only a single race and measuring Facebook’s reported size of the subaudiences for each curated attribute. The figures in parentheses are the recall and representation ratio for a population from North Carolina. The top three most inclusive and exclusive attributes per ethnicity are listed. Note the high representation ratios for the “Most inclusive” column and the low representation ratios for the “Most exclusive” column.
The authors similarly demonstrated that free-form attributes could used in a discriminatory manner. For example, targeting a vulnerable audience could be made possible by targeting the free-form attributes “Addicted,” “REHAB,” “AA,” or “Support group.” The authors also showed how Facebook’s attribute suggestions feature could be used to discover new highly-discriminatory free-form attributes. For example, starting a search with “Fox” (37% conservative audience on Facebook) and following a chain of suggestions leads to “The Sean Hannity Show” (95% conservative audience on Facebook).
Look-Alike Audience Targeting
Look-alike audience targeting allows advertisers to generate a new target audience that looks similar to an existing set of users (the fans of one of their Facebook pages or an uploaded PII data set). The authors show that this feature can be used to scale a biased audience to a much larger population. Experimental results suggest that Facebook attempts to determine the attributes that distinguish the base target audience from the general population and propagates these biases to the look-alike audience. The authors show that this bias propagation can amplify both intentionally created and unintentionally overlooked biases in source audiences.
Algorithmic Transparency via Quantitative Input Influence
Anupam Datta, Shayak Sen, Yair Zick. Algorithmic Transparency via Quantitative Input Influence: Theory and Experiments with Learning Systems. 2016 IEEE Symposium on Security and Privacy (“Oakland”). [PDF]
Machine learning systems are increasingly being used to make important societal decisions, in sectors including healthcare, education, and insurance. For instance, an ML model may help a bank decide if a client is eligible for a loan, and both parties may to know critical details about how the model works. A rejected client will likely want to know why they were rejected: would they have been accepted if their income was higher? The answer would be especially important if their reported income was lower than their actual income; more generally, the client can ensure that their input data contained no errors.
Conversely, the model’s user may want to ensure that the model does not discriminate based on sensitive inputs, such as the legally-restricted features of race and gender. Simply ignoring those features may not be sufficient to prevent discrimination; e.g., ZIP code can be used as a proxy for race. This paper proposes a method to solve these problems by making the model’s behavior more transparent: a quantitative measure of the effect of a particular feature (or set of features) on the model’s decision for an individual. The paper offers several approaches suited for various circumstances, but they all fall under the umbrella of “quantitative input inflence”, or QII.
Unary QII
The simplest quantitative measure presented is unary QII, which measures the influence of one attribute on a quantity of interest \(Q_\mathcal{A}\) for some subset of the sample space \(X\). Formally, unary QII is determined as
where the first term is the actual expected value of \(Q_\mathcal{A}\) for this subset, and the second term is the expected value if the feature \(i\) were randomized.
For example, consider the rejected bank client from above. If they restrict \(X\) to only contain their feature vector, and they set \(Q_\mathcal{A}\) to output the model’s probability of rejection, then unary QII tells how much any individual feature impacted his loan application. If the unary QII for a feature is large, changing the value of that feature would likely increase their odds of being accepted; conversely, changing the value of a feature with low unary QII would make little difference.
The paper presents a concrete example: Mr. X has been classified as a low-income individual, and he would like to know why. Since only 2.1% of people with income above $10k are classified as low-income, Mr. X suspects racial bias. In actuality, the transparency report shows that neither his race nor country of origin were significant; rather, his marital status and education were far more influential in his classification.
The sample space \(X\) can also be broadened to include an entire class of people. For instance, suppose \(X\) is restricted to include people of just one gender, and \(Q_\mathcal{A}\) is set to output the model’s probability of acceptance. Here, unary QII would reveal the influence of a feature \(i\) on men and on women. A disparity between the two measures may then indicate that the model is biased: specifically, the feature \(i\) can be identified as a proxy variable, used by the model to distinguish between men and women (even if gender is omitted as an input feature).
However, unary QII is often insufficent to explain a model’s behavior on an individual or class of individuals. This histogram shows the paper’s results for their “adult” dataset: for each individual, the feature that created the highest unary QII was found, and the unary QII value was plotted in the histogram. Most individuals could not be explained by any particular feature, and most features had little influence by themselves.
Set and Marginal QII
Thankfully, unary QII can easily be generalized to incorporate multiple features at once. Set QII is defined as
where \(S\) is a set of features (as opposed to a single feature, like \(i\) in unary QII). The paper also defines marginal QII
which measures the influence of a feature \(i\) after controlling for the features in \(S\). These two quantitative measures have different use cases, but both are more general (and thus more useful) than unary QII.
Marginal QII can measure the influence of a single feature \(i\), like unary QII, but only for a specific choice of \(S\), and the amount of influence can vary wildly depending on the choice of \(S\). To account for this, the paper defines the aggregate influence of \(i\), which measures the expected influence of \(i\) for random choices of \(S\).
Conclusion
The above variants of QII can be used to provide transparency reports, offering insight into how an ML model makes decisions about an individual. Malicious actors may seek to abuse such a system, carefully crafting their input vector to glean someone else’s private information. However, these QII measures are shown too have low sensitivity, so differential privacy can be added with small amounts of noise.
These QII measures are useful only if the input features have well-defined semantics. This is not true in domains such as image or speech recognition, yet transparency is still desirable there. The authors assert that designing transparency mechanisms in these domains is an important future goal. Nevertheless, these QII measures are remarkably effective on real datasets, both for understanding individual outcomes and for finding biases in ML models.
Language Corpus Bias
Caliskan, A., Bryson, J., & Narayanan, A. (2017). Semantics derived automatically from language corpora contain human-like biases. Science, 356(6334), 183-186. doi:10.1126/science.aal4230 [PDF] [Author’s Full Version PDF]
The focus of this paper is how machine learning can learn from the biases and stereotypes in humans. The main contributions of the authors are:
- Using word embeddings to extract associations in text
- Replicate human bias to reveal prejudice behavior in humans
- Show that cultural stereotypes propagate to widely used AI today
Uncovering Biases in ML
The authors began by replicating inoffensive biases using their original Word-Embedding Association Test (WEAT) method. Word embedding is a representation of words in vector space. WEAT is a test applied to words in AI which represents words as a 300 dimensional vector. The words are then paired by distances between the vectors. Using WEAT, they demonstrated that flowers have pleasant associations and insects have unpleasant associations. Or instruments are more pleasant than weapons. The word embeddings know the properties of flowers or weapons even though they have no experience with them!
After showing that WEAT works, they use this technique to show that machine learning absorbs stereotype biases. In a study by Bertrand and Mullainathan, 5,000 identical resumes were sent out to 1,300 job ads and varied only the names. The European American names were 50% more likely to be offered an opportunity to be interviewed. Based on this study, the authors used WEAT to test the pleasantness associations with the names from Bertrand’s work and found European American names were more pleasant than African American names.
They then turned to studying gender biases. Female names were associated with family as oppose to male names which were associated with career. They also showed woman/girl associated more with arts than math compared to men. These observations were then correlated with data in the labor force. This is show in the figure below:
The authors then applied another method of their creation called Word-Embedding Factual Association Test (WEFAT) to show that these embeddings correlate strongly with the occupations women have in the real world. They then used the GloVe method to find similarity between a pair of vectors. Similarity between vectors is related to the probability that the words co-occur with other words similar to each other. GloVe finds this by doing dimensionality reduction to amplify signal in co-occurring probabilities.
Afterwards, they did a crawl of the internet and got 840 billion words, and each word had a 300 dimension vector derived from counts of other words that occur with it in a 10 word window. WEFAT allowed them to further examine how embeddings capture empirical information. Using this, they were able to predict properties from the given vector.
Conclusion
So what does their work mean? Their results show there’s a way to reveal unknown implicit associations. They demonstrate that word embeddings encode not only stereotyped bias, but also other knowledge like that flowers are pleasant. These results also explain origins of prejudice in humans. It shows how group identity transmits through language before an institution explains why individuals make prejudiced decisions. There are implications for AI and ML because technology could be perpetuating cultural stereotypes. What if ML responsible for reviewing resumes absorbed cultural stereotypes? It’s important to keep this in mind and be cautious in the future.
Men Also Like Shopping: Reducing Bias Amplification
Jieyu Zhao, Tianlu Wang, Mark Yatskar, Vicente Ordonez, Kai-Wei Chang. Men Also Like Shopping:Reducing Gender Bias Amplification using Corpus-level Constraints. 2017 Conference on Empirical Methods in Natural Language Processing. arXiv preprint arXiv:1709.10207. July 2017.
Language is increasingly being used to identify some rich visual recognition tasks. And structured prediction models are widely applied to these tasks to take advantage of correlations between co-ocurring labels and visual inputs. However, inadvertently, there can be social biases encoded in the model training procedure, which may magnify some stereotypes and poses challenge in the fairness of (machine learning) model decision making.
Researchers found that datasets for these tasks contain significant gender bias and models trained on these biased dataset further amplifies these existing biases. An example provided in the paper is, the activity “cooking” is over 33% more likely to refer females than males in the training set, and a model trained on this dataset can further amplify the disparity of gender ratio to 68% at test time. And to tackle the problem, the author proposed to adopt corpus-level constraints for calibrating existing structured prediction models. Specifically, the author limit the gender bias of the model deviate by only a small amount from what is in the original training data.
Problem Formulation
The problem is then defined as maximizing the test time inference likelihood while also satisfying the corpus-level constraint. A bias score for an output \(o\) with respect to demographic variable \(g\)is defined as: $$b(o,g) = \frac{c(o,g)}{\sum_{g^{'}\in G}c(o,g^{'})}$$ where \(c(o,g)\) captures the number of occurrences of \(o\) and \(g\) in a corpus. And a bias might be exhibited if \(b(o,g)>1/||G||\). A mean bias amplification of a model compared to the bias on training data set (i.e., \(b^{*}(o,g)\)) is defined as:
with these terms defined, the author proposes the calibration algorithm: \(\textbf{R}educing~\textbf{B}ias~\textbf{A}mplification\) (RBA). Intuitive understanding the of calibration algorithm is to inject constraints to ensure the model predictions follow the gender distribution observed from the training data with allowbable small deviations.
Structured Output Prediction
Given a test insatnce, the inference problem at test time is defined as: $$\underset{y\in Y}{\operatorname{argmax}}f_{\theta}(y,i)$$
with \(f_{\theta} (y,i)\) is a scoring function based on model \(\theta\) learned from training data. The inference problem hence can be interpreted as finding the structured oupt \(y\) such that the scoring function is maximized. The corpus level constraint is expressed as:
With the given constraint, the problem is formulated as:
where \(i\) refers to insatnce \(i\) in test dataset.
The corpus level constraint is represented by \(A\sum_{i}y^{i}-b \leq 0\), where the matrix \(A\in R^{l \times K}\) is the coefficients of one constraint, and \(b \in R^{l}\). Note that, above formulation can be solved individually for each instance \(i\).
Lagrangian Relaxation
The final optimization problem is a mixed integer programming problem, and solving with off-the-shell solver is inefficient for large-scale dataset. Hence, the author proposed to solve the problem with Lagrangian relaxation technique. With a lagrangian multiplier introduced, we have the Lagrangian as
where \(\lambda_{j} \geq 0, \forall \in {1,…,l}\). The solution to the problem is then obtained by iteratively optimizing the problem with respect to \(y^{i}\) and \(\lambda\). Specifically, we need two steps in each optimization iteration:\
- At iteration \(t\), first get the output solution of each instance \(i\)
Experimental Setup
This problem is evvaluated on two vision recognition tasks: visual semantic role labeling (vSRL), and multi-label classification (MLC). The authors focus on the gender bias problem, where \(G = \{man, woman\}\) and focus on the agent and any occurrence in text associated with the images in MLC.
Dataset and Model
The experiment of vSRL is conducted on imSitu where activity classes are drawn from verbs and roles in FrameNet and noun categories are drawn from WordNet. The model is built on the baseline CRF released with the data, which has been shown effective compared to a non-structured prediction baseline [2]. The experiment of MLC is conducted on MS-COCO. The model is a similar model as CRF that is used for vSRL.
Result analysis
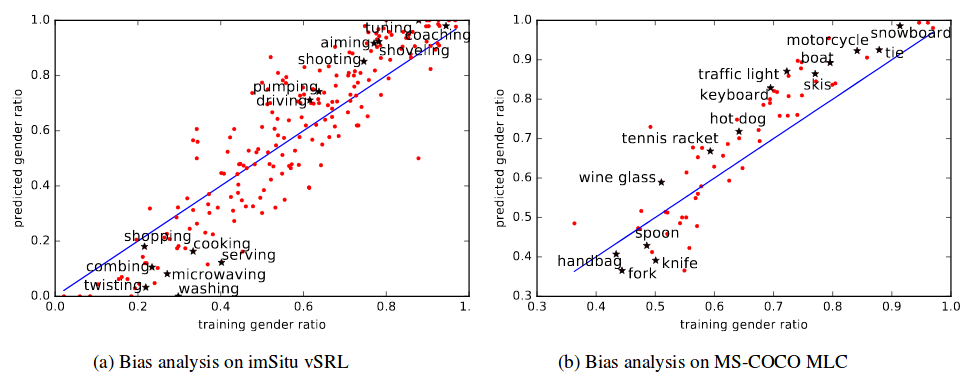
For both the vSRL and MLC tasks, their training data is biased as illustrated in Figure 2. Y-axis denotes the percentage of male agents and x-axis represents gender bias in training data. It is clear that many verbs are biased in the training set and when a model is trained on these biased training datasets, the gender bias is further amplified. Figure 2(a) denotes demonstrates the gender bias in vSRL task and figure 2(b) shows the gender bias in MLC task. Some seemingly neutral words like “microwaving” and “washing” is heavily biased towards female and other words like “driving” is beavily biased towards male.
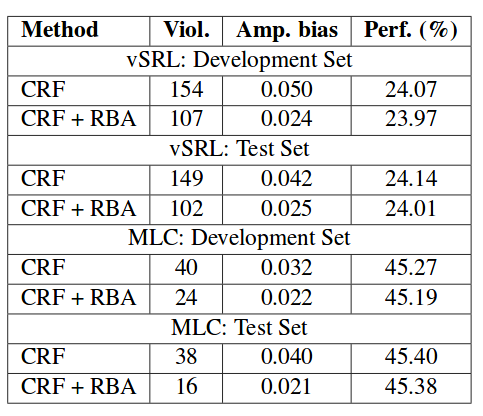
Calibration results are then summarized in the table below, which utilizes RBA method. The experimental results show that, with this calibrated method, we are able to significantly reduce the gender bias.
—– Team Gibbon: Austin Chen, Jin Ding, Ethan Lowman, Aditi Narvekar, Suya
References
[1] Till Speicher, Muhammad Ali, Giridhari Venkatadri, Filipe Nunes Ribeiro, George Arvanitakis, Fabrício Benevenuto, Krishna P. Gummadi, Patrick Loiseau, Alan Mislove. “Potential for Discrimination in Online Targeted Advertising.” Proceedings of the 1st Conference on Fairness, Accountability and Transparency, PMLR 81:5-19, 2018.
[2] Anupam Datta, Shayak Sen, Yair Zick. “Algorithmic Transparency via Quantitative Input Influence: Theory and Experiments with Learning Systems.” 2016 IEEE Symposium on Security and Privacy (SP), 2016.
[3] Aylin Caliskan, Joanna J. Bryson, Arvind Narayanan. “Semantics derived automatically from language corpora contain human-like biases.” Science Magazine, 2017.
[4] Rush, Alexander M., and Michael Collins. “A tutorial on dual decomposition and Lagrangian relaxation for inference in natural language processing.” Journal of Artificial Intelligence Research (2012).
[5] Yatskar, Mark, Luke Zettlemoyer, and Ali Farhadi. “Situation recognition: Visual semantic role labeling for image understanding.” Proceedings of the IEEE Conference on Computer Vision and Pattern Recognition. 2016.
[6] Baker, Collin F., Charles J. Fillmore, and John B. Lowe. “The berkeley framenet project.” Proceedings of the 17th international conference on Computational linguistics-Volume 1. Association for Computational Linguistics, 1998.
[7] Miller, George A., et al. “Introduction to WordNet: An on-line lexical database.” International journal of lexicography 3.4 (1990): 235-244.
[8] Lin, Tsung-Yi, et al. “Microsoft coco: Common objects in context.” European conference on computer vision. Springer, Cham, 2014.
[9] Andreou, Athanasios, et al. “Investigating ad transparency mechanisms in social media: A case study of Facebook’s explanations.” NDSS, 2018.